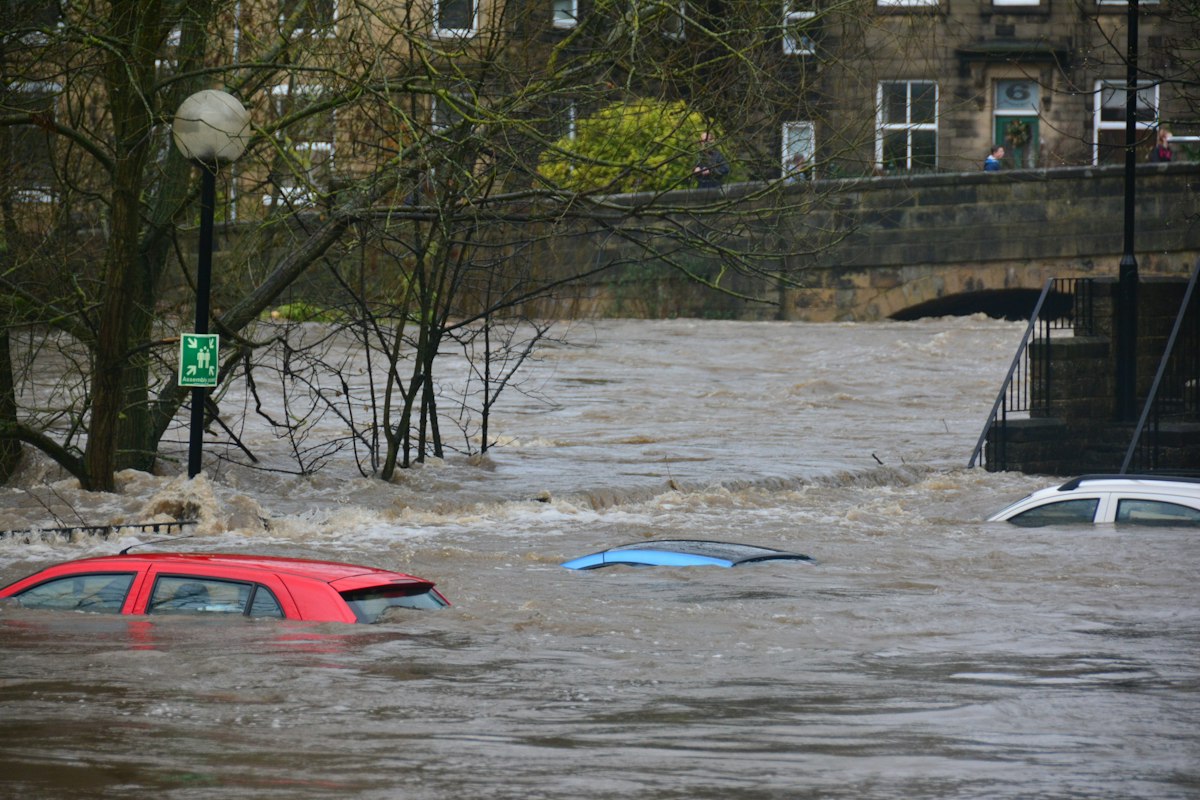
Around 6.3 million properties in England are in areas at risk of flooding from rivers, the sea or surface water — and 4.6 million of them are at risk from surface water alone. Those are the headline figures from the Environment Agency's updated National Assessment of Flood and Coastal Erosion Risk (widely known as NaFRA2), and they are the numbers planners, lenders and insurers are now working from in 2026.
This page gathers the key flood risk statistics for England in one place, lets you check your own flood zone instantly, explains why the surface-water figure rose so sharply, and sets out when a planning application needs a flood risk assessment.
Check your flood zone now (free tool)
Type a postcode and this checker queries the Environment Agency's Flood Zone 2/3 planning dataset (via planning.data.gov.uk) live:
The interactive checker needs JavaScript enabled. Without it, you can check your site on the official Flood Map for Planning.
Flood risk statistics England 2026: the headline numbers
| Measure | Figure | Source |
|---|---|---|
| Properties in areas at risk of flooding (all sources) | ~6.3 million | Environment Agency NaFRA (published December 2024) |
| Properties in areas at risk from surface water | ~4.6 million | Environment Agency NaFRA |
| Increase in the surface-water figure vs the previous assessment | +43% | Environment Agency NaFRA |
| Properties at high risk from surface water | ~1.1 million | Environment Agency NaFRA |
Surface water — rainfall overwhelming drains and flowing over the ground before it ever reaches a river — is now clearly England's most widespread flood source, affecting far more properties than rivers and the sea.
Why did the surface water flood risk figure jump 43%?
The Environment Agency is explicit on this point: the jump is driven by better data and modelling, not a sudden increase in real-world risk. NaFRA2 uses improved terrain data, updated rainfall inputs and national-scale modelling that picks up localised flow paths older assessments missed. Nearly 1.1 million properties are now assessed as being at high risk from surface water — close to three times the previous estimate.
The practical consequence for development is significant: many sites that never considered drainage a planning issue now sit on mapped surface-water flow paths, and local planning authorities and their drainage engineers can see those maps. The Agency's 2026 work on flood risk inequality underlines how seriously this data is now taken across government.
NaFRA vs the Flood Map for Planning — which one matters for your application?
The two datasets answer different questions, and mixing them up causes real confusion:
- NaFRA is the national risk assessment — it powers the government's check your long-term flood risk service and describes likelihood for existing properties.
- The Flood Map for Planning defines Flood Zones 1, 2 and 3 for the sequential test and determines what your planning application must include. Its May 2026 update added surface-water climate-change extents and banded depth data — we covered exactly what changed in our guide to the 2026 Flood Map for Planning update.
In short: NaFRA tells you how risky a property is; the Flood Map for Planning tells you what your application has to prove. The checker above uses the planning dataset — the zones your council will look at.
Do you need a flood risk assessment? Quick lookup table
| Your situation | FRA needed with your application? |
|---|---|
| Site in Flood Zone 2 or Flood Zone 3 (any size) | Yes |
| Site in Flood Zone 1 and larger than 1 hectare | Yes |
| Site in Flood Zone 1 with known surface-water or drainage problems (e.g. on a critical drainage area or a mapped flow path) | Yes — councils increasingly ask |
| Site within 20 metres of a main river or a flood defence | Yes |
| Change of use to a more vulnerable category (e.g. commercial to residential) in a flood risk area | Yes |
| Small householder extension in Flood Zone 1 with no surface-water issues | Usually no |
The full rules sit in the government guidance on flood risk assessments for planning applications. If you are unsure which row you fall into, the checker above takes seconds and costs nothing.
What the 2026 numbers mean if you are building
- Expect surface water scrutiny everywhere — even Flood Zone 1 sites now routinely attract drainage conditions, and a SuDS strategy to CIRIA C753 is the standard answer.
- Sequential thinking first — with 6.3 million properties already in at-risk areas, the NPPF steers new development towards the lowest-risk land available.
- Data beats assumption — decisions are made on the Environment Agency's live mapping, so your FRA should be built from the same data.
How Fortress Associates can help
Our automated flood risk assessment service produces a site-specific FRA for UK planning applications using live Environment Agency data — flood zone screening, surface water risk, sequential and exception test support, and a SuDS drainage strategy to CIRIA C753, following the Environment Agency's FRA template (March 2025). The report is free and ready in minutes for householder extensions, new dwellings and small-scale applications across England. See all our planning report services or get in touch to talk through your site.
Sources & further reading
Need help with a UK planning project?
Fixed-fee daylight & sunlight reports and Building Regulations drawings — delivered in 4–5 working days, no advance payment — plus flood risk assessments, air quality assessments, energy statements and sustainability statements for planning applications across the UK.
Request a free quote