Pluvial vs Fluvial Flooding: Check Your UK Risk
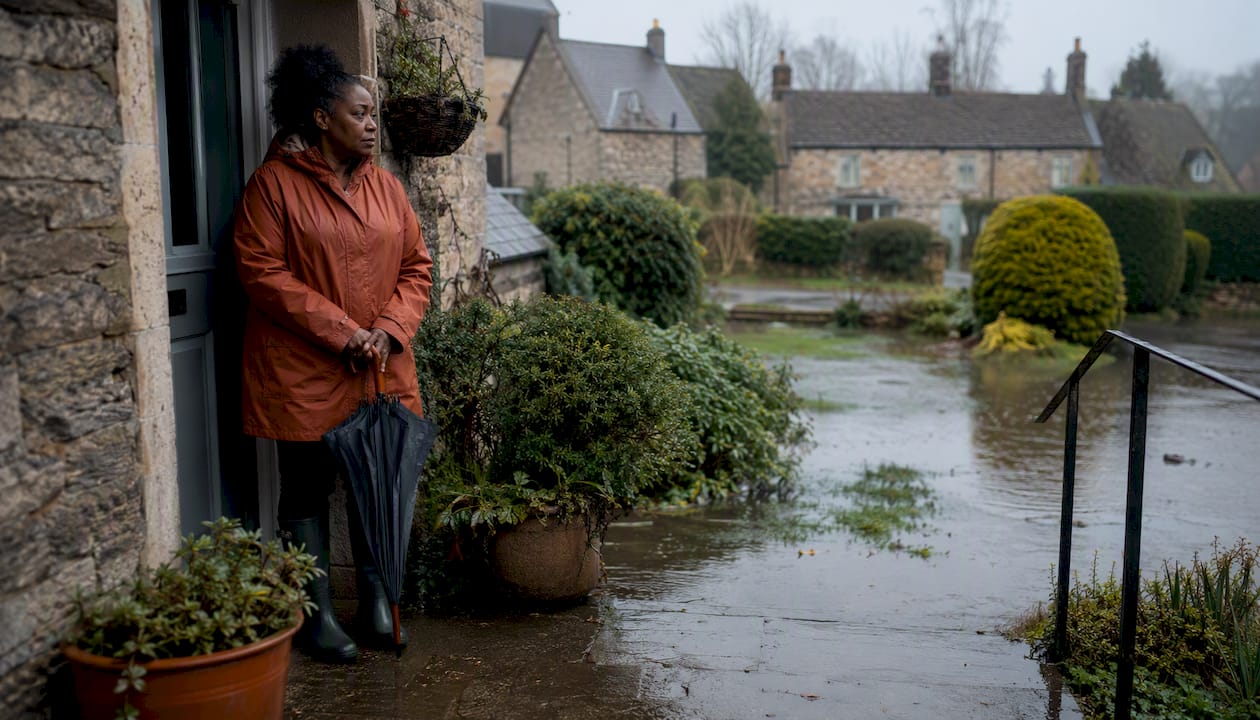
Pluvial (surface-water) flooding happens when intense rainfall overwhelms land and drainage systems, causing water to pond and flow overland. Fluvial (river) flooding happens when a river or stream overtops its banks after sustained catchment-wide rainfall. The core difference is the water source: pluvial comes from the sky and stays on the surface; fluvial comes from a river that has run out of room.
That distinction matters practically because the two types behave differently in almost every way that counts for safety and planning. Pluvial events can develop within minutes to a few hours, often with little warning. Fluvial events typically build over hours to days, giving more lead time but potentially lasting longer and reaching greater depths.
Quick identification cues:
- Where it happens: Pluvial flooding can strike anywhere, including areas well away from rivers, particularly in urban streets, car parks, and low-lying gardens. Fluvial flooding concentrates along river floodplains, valleys, and downstream reaches.
- Typical cause: Pluvial is triggered by short, intense downpours that exceed drainage capacity. Fluvial is driven by sustained or catchment-wide rainfall that fills a river system beyond its channel capacity.
- Who to contact in the UK: For fluvial risk, the Environment Agency is the lead authority. For surface-water (pluvial) risk, your Lead Local Flood Authority (LLFA) is responsible. Both sources must be addressed in a Flood Risk Assessment (FRA) submitted under the National Planning Policy Framework (NPPF). Check the Environment Agency’s Flood Map for Surface Water and Risk of Flooding from Rivers and Sea for your site.
Table of Contents
- How do pluvial and fluvial flooding compare?
- What is fluvial flooding and how does it develop?
- What is pluvial flooding and why can it happen anywhere?
- How do the impacts of each flood type differ?
- How is each flood type modelled, and where can you check UK maps?
- Who manages flood risk in the UK, and what does the NPPF require?
- What can homeowners, developers, and local authorities do to reduce flood risk?
- What happens when pluvial and fluvial flooding combine?
- What do UK statistics tell us about pluvial flood risk?
- Key Takeaways
- Why integrated flood assessment is the only honest approach
- Clockfortress can handle your flood risk assessment
- Useful sources for further reading
How do pluvial and fluvial flooding compare?
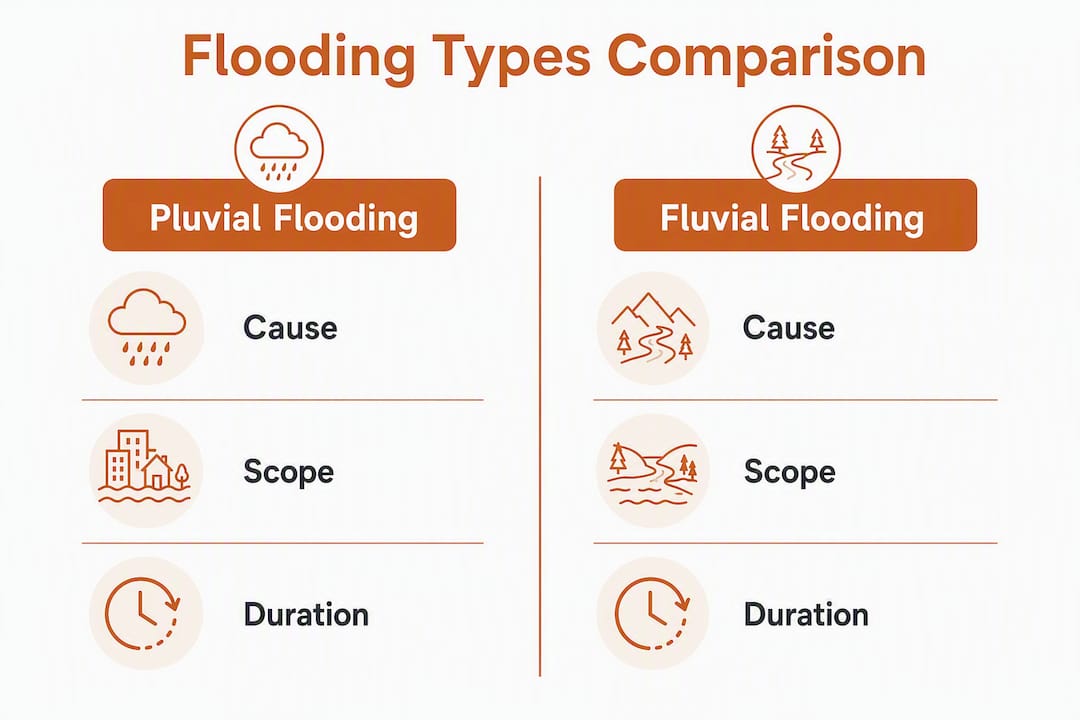
| Dimension | Pluvial (surface-water) | Fluvial (river) |
|---|---|---|
| Cause / water source | Intense local rainfall exceeding infiltration and drainage capacity | Sustained or catchment-wide rainfall causing river or stream overflow |
| Trigger / timescale | Short, intense downpours; convective storms | Prolonged rainfall, rapid snowmelt, or blocked channels across a catchment |
| Warning time / predictability | Minutes to a few hours; highly localized and hard to predict | Hours to days; catchment response gives more lead time |
| Typical locations affected | Urban streets, car parks, low-lying gardens, anywhere drainage is inadequate | River floodplains, valleys, downstream communities |
| Depth vs areal extent | Often shallower but covers a wider, more diffuse area | Can be deeper close to the channel; more spatially concentrated |
| Modelling & mapping approach | High-resolution 2D surface-water / integrated urban drainage models; Flood Map for Surface Water (Environment Agency) | Catchment hydrology and 1D/2D hydraulic models; Risk of Flooding from Rivers and Sea (Environment Agency) |
| Who is responsible in the UK | Lead Local Flood Authority (LLFA) | Environment Agency (main rivers); LLFAs (ordinary watercourses) |
| Typical mitigation measures | SuDS, permeable surfaces, sewer separation, property-level flood barriers | River defenses, flood storage areas, channel maintenance, raised floor levels |
What is fluvial flooding and how does it develop?
Fluvial flooding occurs when a river or stream exceeds its channel capacity and spills onto the surrounding floodplain. The trigger is almost always sustained or catchment-wide rainfall, though rapid snowmelt and blocked channels can also push a river over its banks.
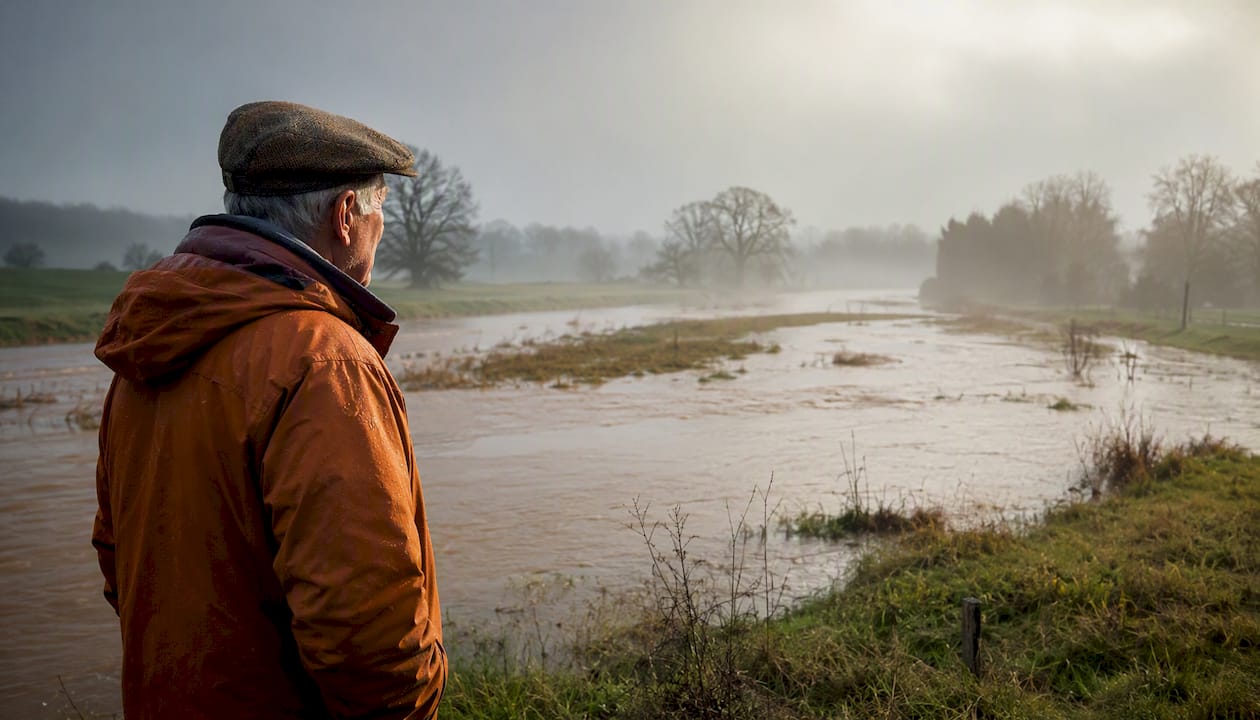
The key to understanding fluvial risk is the catchment. Rain falling across a large drainage area gradually accumulates in the river network. As upstream tributaries contribute their flow, water levels rise progressively downstream, which is why communities far from the rainfall source can still flood. Floodplain storage, where water spreads out across low-lying land adjacent to the channel, can buffer peak flows, but once that storage is overwhelmed, depth and duration both increase significantly.
Common fluvial triggers and locations:
- Prolonged rainfall across a catchment over several days
- Rapid snowmelt, particularly when combined with rain
- Blocked or undersized culverts restricting channel flow
- River valleys, low-lying floodplains, and downstream urban areas adjacent to main rivers or ordinary watercourses
Fluvial events tend to be deeper and longer-lasting than pluvial events in the areas they affect. A river in flood can remain above bankfull for days, causing sustained damage to structures, infrastructure, and agricultural land.
Pro Tip: If your site sits within or adjacent to a floodplain, the Environment Agency’s modelling guidance sets out when a 1D/2D hydraulic model is required for a planning FRA. Commissioning that model early, before design is fixed, avoids costly redesigns at the planning stage.
What is pluvial flooding and why can it happen anywhere?
Pluvial flooding is surface-water ponding and overland flow caused when rainfall intensity exceeds the combined capacity of the ground to absorb it and the drainage network to carry it away. The term “surface-water flooding” is used interchangeably in UK planning and emergency management.
What makes pluvial flooding genuinely different from fluvial flooding is its independence from watercourses. It can strike a site that sits nowhere near a river, simply because the local topography creates a natural low point, the soils are saturated, or the drains are already at capacity. Urban areas are particularly exposed: concrete, tarmac, and rooftops prevent infiltration, and combined sewer systems can surcharge quickly during intense storms, pushing water back up through drains and gullies.
Signs of pluvial risk at a local level:
- Regularly saturated ground or standing water after moderate rain
- Local drainage choke points such as undersized culverts, blocked gullies, or low points in the road network
- Previous surface-water flood events reported to the LLFA or visible in the Environment Agency’s Flood Map for Surface Water
- Micro-catchments where surrounding higher ground channels runoff toward a single low point on or near your site
The JRF study on pluvial flooding in urban areas describes it as an “invisible hazard” precisely because it can catch property owners and developers off-guard in areas they assumed were safe. Being in Flood Zone 1 on the Environment Agency’s river and sea maps does not mean a site is free from surface-water risk.
How do the impacts of each flood type differ?
The physical characteristics of pluvial and fluvial flooding produce different damage profiles, and understanding those differences shapes both personal safety decisions and design choices.
Pluvial events tend to be shallower, often 150–300 mm in residential streets, but they cover a wide, diffuse area and arrive fast. That speed is the primary life-safety concern. Flash floods are the most dangerous flood type because they combine high velocity with little warning time, and pluvial events can transition into flash floods on steep or impermeable terrain. Debris carried in fast-moving surface water adds to structural and personal injury risk.
Fluvial flooding, by contrast, tends to be deeper in channel-adjacent areas and can persist for days. Depths of a metre or more are not unusual in low-lying floodplain properties during significant river events. That prolonged inundation causes greater structural damage, longer displacement of residents, and more extensive contamination of building fabric.
A significant portion of properties at risk of flooding in the UK face primarily pluvial rather than fluvial or tidal risk. The JRF estimates that nearly 2 million people currently face a 0.5% annual probability (a 1-in-200-year event) of surface-water flooding, with projections suggesting that figure could reach around 3.2 million by 2050.
A specific concern with pluvial flooding is the mixing of surface water with combined sewer systems. When drains surcharge, foul water can back up into streets and properties alongside the stormwater, creating serious sanitation and public health risks that go beyond the physical flood damage itself.
How is each flood type modelled, and where can you check UK maps?
The modelling approaches for fluvial and pluvial flooding reflect their different physical drivers, and knowing which map to consult for which purpose saves time when assessing a site.

For fluvial risk, catchment-scale hydrological models estimate how much water enters the river system, and 1D or 2D hydraulic models then route that water through the channel and floodplain. The Environment Agency’s river modelling standards set out what regulators expect: established modelling tools, documented sensitivity testing, and clear assumptions about channel geometry and roughness. The outputs feed directly into the Risk of Flooding from Rivers and Sea map.
For pluvial risk, high-resolution 2D surface-water models simulate overland flow paths across the terrain. Integrated urban drainage models can also incorporate sewer network behavior, which matters in dense urban areas where sewer surcharge is a significant driver. These models are more sensitive to the quality of terrain data (LiDAR resolution) and to the assumed storm duration and intensity, which makes them harder to generalize across large areas.
| Map / model source | What it shows | Intended use | Key caveats |
|---|---|---|---|
| Risk of Flooding from Rivers and Sea (Environment Agency) | Fluvial and tidal flood probability zones | Planning (Flood Zones 1–3), FRA scoping | Does not show surface-water risk; updated periodically |
| Flood Map for Surface Water (Environment Agency) | Surface-water (pluvial) flood extent and depth | Planning, LLFA risk management | Based on national-scale modelling; local detail may require site-specific assessment |
| LLFA surface-water maps | Locally refined pluvial hotspots | Local planning and emergency response | Availability and resolution vary by authority |
| Site-specific hydraulic model | Detailed flood levels and extents for a specific site | FRA submission, design | Requires specialist commissioning; validated against observed data |
Pro Tip: Use the free UK planning tools available through the Environment Agency and Clockfortress to run a quick map check before commissioning a formal FRA. A five-minute check can tell you which flood sources are relevant and which authority to contact first.
Who manages flood risk in the UK, and what does the NPPF require?
Responsibility for flood risk in the UK is split by flood source, and getting that split wrong in a planning application is one of the most common causes of delay.
The Environment Agency leads on fluvial (main river) and tidal flood risk. It maintains the national flood maps, sets modelling standards, and is a statutory consultee on planning applications in Flood Zones 2 and 3. Lead Local Flood Authorities, typically the county or unitary authority, are responsible for surface-water and ordinary watercourse risk. LLFAs produce Preliminary Flood Risk Assessments, maintain local surface-water maps, and are statutory consultees for surface-water drainage in new developments.
The NPPF requires that development in flood-risk areas pass a sequential test and, where necessary, an exception test. Site-specific FRAs must address all relevant flood sources, including climate change allowances. That means a site in Flood Zone 1 is not automatically exempt from a surface-water assessment.
What a site-level FRA must demonstrate for each flood source:
- Fluvial: flood extents and levels for the 1% annual probability (1-in-100-year) event plus climate change; residual risk after any proposed defenses; safe access and egress
- Pluvial: surface-water flow paths and ponding areas; drainage capacity; proposed SuDS or attenuation measures; finished floor levels set above modeled surface-water depths
- Both sources: joint probability where the site is exposed to compound risk; demonstration that flood risk is not increased elsewhere
Pro Tip: Assuming Flood Zone 1 means no flood risk is the single most common planning mistake Clockfortress sees. A site can sit entirely in Flood Zone 1 and still face significant pluvial risk. Always check the LLFA’s surface-water maps and the Environment Agency’s Flood Map for Surface Water before concluding that no FRA is needed.
What can homeowners, developers, and local authorities do to reduce flood risk?
Mitigation measures differ by flood type, but the most cost-effective approach targets both sources at once.
Homeowner measures
Property-level resilience works for both flood types, though the specifics differ. For pluvial risk, non-return valves on drains and toilets prevent sewer surcharge from backing up into the property. Raised door thresholds and flood barriers protect against fast-moving surface water. For fluvial risk, the same barriers apply, but the longer duration means water-resistant internal finishes and raised electrical sockets become more important. Every household in a flood-risk area should have a personal flood plan and know the Environment Agency Floodline number (0345 988 1188).
Developer and planner measures
Sustainable Drainage Systems (SuDS) are the primary tool for managing pluvial risk in new development. Permeable paving, green roofs, rain gardens, and detention basins slow runoff and reduce peak flows entering the drainage network. Separating storm and foul water prevents sewer surcharge from contaminating surface-water flood events. For fluvial risk, compensatory flood storage, finished floor levels set above the 1% plus climate change flood level, and keeping flow paths clear of obstruction are the core design responses.
Local authority and infrastructure measures
Councils and drainage authorities manage the maintenance of gullies, culverts, and ordinary watercourses, which directly affects pluvial risk, as detailed in Sydney Water Tap in: A Guide for Property Owners. For fluvial risk, river channel maintenance, flood-warning systems, and formal flood defenses such as embankments and flood walls are the primary tools. Surface-water hotspot mapping and community engagement help residents understand localized pluvial risk that national maps may not capture at sufficient resolution.
Pro Tip: Prioritize measures that reduce risk from both sources simultaneously. Raising finished floor levels, maintaining clear drainage paths, and installing non-return valves all reduce vulnerability regardless of whether the next event is pluvial or fluvial. Low-regret measures like these pay back across multiple hazard scenarios.
What happens when pluvial and fluvial flooding combine?
Compound flooding occurs when two or more flood sources interact, and the combined effect is typically worse than either source alone. The most common UK scenario is a river already running high from sustained catchment rainfall when a convective storm delivers intense local rain. The drainage network, already stressed, surcharges. Surface water that would normally drain away quickly has nowhere to go. The result is deeper, more extensive flooding than either the river model or the surface-water model would predict in isolation.
Joint probability analysis quantifies the likelihood of two sources occurring simultaneously or in close sequence. For sites near both a main river and a surface-water hotspot, regulators may require this analysis as part of the FRA, particularly where the consequences of underestimating combined risk are severe.
Signals that compound risk may be present at your site:
- The site sits in or near Flood Zone 2 or 3 AND appears on the Flood Map for Surface Water
- Historical flood records show events that cannot be explained by river levels alone
- The site is in a low-lying urban area where sewer surcharge has been reported during past storms
- Drainage outfalls discharge to a watercourse that itself floods, creating a backwater effect
When any of these signals are present, request a joint probability assessment early in the design process. Retrofitting compound risk analysis after a scheme is designed is expensive and often forces redesign.
What do UK statistics tell us about pluvial flood risk?
Surface-water flooding is not a secondary concern in the UK. It accounts for roughly one-third of flood risk in the urban context, yet it receives far less public attention than river flooding because it lacks the visible drama of an overtopping river.
The JRF’s research on pluvial flooding in urban areas puts nearly 2 million people at a 0.5% annual probability of surface-water flooding today, with projections of around 3.2 million by 2050 as climate change intensifies convective rainfall and urban expansion increases impermeable surfaces. Those projections carry real uncertainty: short, intense convective storms are among the hardest meteorological events to model at the spatial resolution needed for urban drainage planning. That uncertainty is itself an argument for conservative design assumptions and SuDS-based solutions that perform well across a range of storm intensities.
Surface-water flooding currently exposes a substantial number of people in the UK to a low annual flood probability, with projections suggesting that this exposure may grow considerably by 2050.
For planning purposes, that uncertainty cuts both ways. A site that appears low-risk on current national surface-water maps may face materially higher risk by the time a building reaches the end of its design life. The NPPF’s climate change allowances exist precisely to address this: they require FRAs to test flood levels under future climate scenarios, not just present-day conditions.
Key Takeaways
Pluvial and fluvial flooding require separate mapping, separate responsible authorities, and often separate mitigation strategies, but both must be addressed in any UK Flood Risk Assessment.
| Point | Details |
|---|---|
| Different sources, different maps | Check the Flood Map for Surface Water (pluvial) AND Risk of Flooding from Rivers and Sea (fluvial) for every site. |
| Flood Zone 1 is not a green light | A site in Flood Zone 1 can still carry significant surface-water risk; always consult LLFA maps. |
| Nearly 2 million people at pluvial risk | JRF data shows around 2 million people face a 0.5% annual surface-water flood probability today, projected to reach 3.2 million by 2050. |
| Compound events need joint analysis | Sites exposed to both river and surface-water risk may require joint probability modelling; commission it early. |
| Clockfortress for FRAs | Clockfortress prepares Flood Risk Assessments using live official data, covering both pluvial and fluvial sources, with an amend-or-refund guarantee. |
Why integrated flood assessment is the only honest approach
Most flood risk conversations in the UK still default to the river flood zone map. It’s the most visible tool, the one planning portals show first, and the one most applicants check before concluding they’re fine. That framing is outdated.
The evidence is clear: surface-water flooding affects more properties in aggregate than river flooding in many urban areas, it arrives faster, it’s harder to predict, and it can strike sites that have never appeared on a flood zone map. Yet the planning system has historically treated it as a secondary concern, something to address in drainage strategy rather than in the core FRA. That gap is closing, partly because LLFAs are now statutory consultees on surface-water drainage, and partly because the consequences of ignoring pluvial risk are showing up in planning appeals and insurance claims.
What I find most striking is how often compound risk is missed entirely. A developer checks the river flood zone, finds Zone 1, and stops. Nobody models what happens when a 1-in-100-year convective storm hits a site that also sits at the low point of a local micro-catchment. That’s not a rare edge case. It’s a routine planning gap.
The right approach is to treat both sources as equally real from day one: check both sets of maps, engage both responsible authorities, and design drainage and floor levels to handle the worst credible combination. That’s not overcaution. It’s what the NPPF already requires, and it’s what protects both the development and the people who will live or work in it.
Clockfortress can handle your flood risk assessment
Flood Risk Assessments that address only one source are increasingly likely to draw objections from either the Environment Agency or your LLFA. Clockfortress prepares FRAs that cover both pluvial and fluvial sources using live official data from the Environment Agency and LLFA mapping, with climate change allowances applied correctly from the start.

Every report is validated against current NPPF standards and Environment Agency modelling guidance before delivery. If a report is rejected by the planning authority, Clockfortress will amend or refund it. No advance payment is required: you review the completed report before paying. Whether your site is in Flood Zone 2, sits near an ordinary watercourse, or appears on the Flood Map for Surface Water, the team can scope and deliver the right assessment. Commission your Flood Risk Assessment or review the full range of planning reports at clockfortress.com.
Useful sources for further reading
Official maps and planning guidance:
- Flood risk and coastal change guidance (GOV.UK) - covers the sequential test, FRA requirements, and all flood sources including surface water
- Using modelling for flood risk assessments (GOV.UK) - the technical standard for hydraulic and surface-water modelling in planning submissions
Research and evidence:
- Preliminary Flood Risk Assessments and flood risk areas (GOV.UK) - explains LLFA and Environment Agency responsibilities under the Flood Risk Regulations
Quick checks and contacts:
- Your LLFA (county or unitary authority) for surface-water flood history, local maps, and drainage queries
- Free UK planning tools (Clockfortress) - a curated set of free map and constraint checks including flood zone and surface-water risk
Recommended
- Flood Risk Statistics England 2026: How Many Homes Are at Risk? - Fortress Associates
- Flood Risk Assessments for Sites Near Rivers and Watercourses - Fortress Associates
- Surface Water Flooding: The Flood Risk Most Planning Applicants Miss - Fortress Associates
- Flood Risk Assessments for Basement Conversions and Lightwells (2026) - Fortress Associates
Need help with a UK planning project?
Fixed-fee daylight & sunlight reports and Building Regulations drawings - plus flood risk assessments, air quality assessments, energy statements and sustainability statements for planning applications across the UK.
Request a free quote